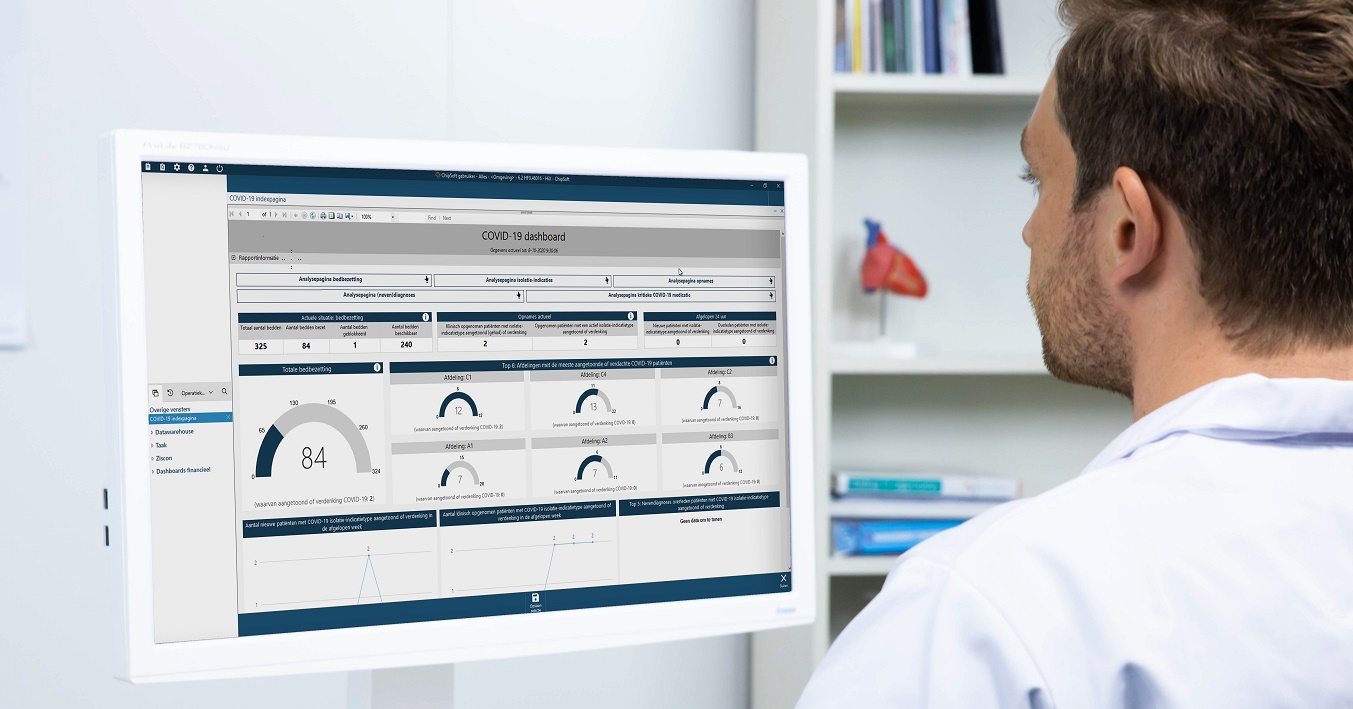
In March this year, ChipSoft launched its first COVID dashboard. Now, it has developed an improved version that can be downloaded directly and without additional fees by all healthcare organisations that use HiX, regardless of whether they use Data Warehouse. Vincent Bakkum, head of the Data Warehouse project team, tells us more about this new and improved dashboard and Data Warehouse, both during and after the COVID-19 pandemic.
The first versions of our COVID dashboard already had the core numbers, insights into patients with isolation registrations, infections, suspicions, and potential additional isolation registrations. For the newest version of the dashboard, the definitions have been optimised with in cooperation with clients, the Dutch National Institute for Public Health and the Environment (RIVM), the National Intensive Care Evaluation (Stichting NICE) and the national coordination centre for bed capacity and patient distribution, the LCSP. With these optimisations, the definitions match the national guidelines and practice even more closely.
Additionally, the COVID-19 and non-COVID-19 admission clusters can be found in the dashboard, and new analysis pages have been added with, among other things, main and secondary diagnoses. This way, the other non-COVID-19 diagnoses are displayed as well and, on the basis of medical diagnoses, linked to ICD10 diagnoses. The diagnostic groups with underlying diagnoses are displayed in three categories: patients diagnosed with COVID-19, admissions of patients diagnosed with COVID-19, and deceased COVID-19 patients. Due to this optimisation, the dashboard definitions correspond perfectly with the definitions of the data deliveries to various organisations. Moreover, the expansions enable further analysis.
Useful filters
The pages of the dashboard that was launched in March, after following the first outbreak of COVID-19, have been expanded with additional filters. These include type of isolation registration, bed type, department, available beds, locations, and admission type and subtype. The expansion of the filter possibilities allows every organisation to adjust the dashboard so that it meets the specific information needs for every situation.
The 'Critical COVID-19 medication admission analysis page' and 'Isolation registration page' have also been expanded with extra insights. For example, a number of vital COVID-19 medications have been specified. The healthcare organisations themselves can add more medications to this list. The number of administrations of these medications to both COVID-19 and non-COVID-19 patients in the past period is displayed per medication, as well as the age and sex of the patients. You can also view the use and stock in one or more repositories. You can still directly open HiX from the dashboard, and it is still possible to export data to Excel, for example.
A single 'truth'
The Data Warehouse always shows the data in the dashboards and reports in the same way as it is recorded in HiX. This way, the data are always consistent with what is entered into HiX, which prevents multiple 'truths' from arising. This is not only true for the COVID-19 dashboard, but also for all other dashboards that ChipSoft develops. The strict quality checks that HiX is subject to also apply to our Data Warehouse reports, which are validated by our registration experts in HiX.
The right place and the right time
All our dashboards can be accessed directly from HiX. Due to the fact that the HiX Data Warehouse is a part of HiX, hospital staff can easily open the COVID dashboard while working in HiX. This way, they can easily access the data and insights they need, directly when needed. We continually monitor how we can give our clients the best possible help. As the COVID-19 situation progresses, information that is most relevant at that moment is added to the dashboard.
Directly to HiX to take action
The power of Data Warehouse is converting data to information that can directly be applied in practice. Insight into and information about specific situations, such as the ICU bed occupancy and the number of infections, is naturally very important and useful.
Many hospitals use dashboards that provide a quick outline of the national situation, but insight into the hospital's own situation can still be improved. Our dashboard gives all healthcare organisations that use HiX the possibility to zoom in on their own situations, whether they use our Data Warehouse or not. Moreover, users can directly open HiX through this dashboard, eliminating the need to switch to another application. In this way, the dashboard becomes an actual part of the work process. The dashboard offers hospitals a clear overview with tools to zoom in on details and to take direct action when and where needed.
Available in the Netherlands and Belgium
The COVID-19 dashboard is available in both the Netherlands and Belgium without additional costs and it is directly available for all HiX hospitals. It provides individual hospitals with information regarding situations relevant to COVID-19 patients in their care.
Hospitals that use HiX and wish to start using our improved COVID-19 dashboard right away can find clear instructions on how to activate the dashboard on our support website. Naturally, our project team is standing by to answer any questions they might have through the usual support channels.
Some hospitals do use HiX but don't work with our Data Warehouse. We can allow them access to data elements through a SSIS solution. These elements can then be opened with SSRS and PowerBI reports. They can also choose to connect their own reporting tools to the data.
Want to know more?
For more information about the dashboard, please contact your account manager, or send an email to communicatie@chipsoft.com.


